Observability Setup
I'll give you visibility so you stop flying blind.
Who Needs This
SaaS founders
You have users but no idea what's happening under the hood.
Agencies
You manage client systems. You need dashboards that actually work.
Dev teams without dedicated ops experience
You can code but don't want to learn monitoring infrastructure.
Companies that had one outage
You never want to be blind again.
Want the quick background? About me.
What I Install
Prometheus
Metrics collection from your services, databases, and infrastructure.
Grafana
Dashboards showing what matters: response times, errors, resource usage.
Alerts
Configured to notify you when things break, not just when they slow down.
Logs
Centralized logging so you can actually debug production issues.
Why This Matters
You can't fix what you can't see
Before your customers tell you.
Logs and metrics in one place. No more SSH-ing into servers.
See where you're slow. Fix bottlenecks with evidence.
Alerts go to Slack or PagerDuty. You know if something's wrong.
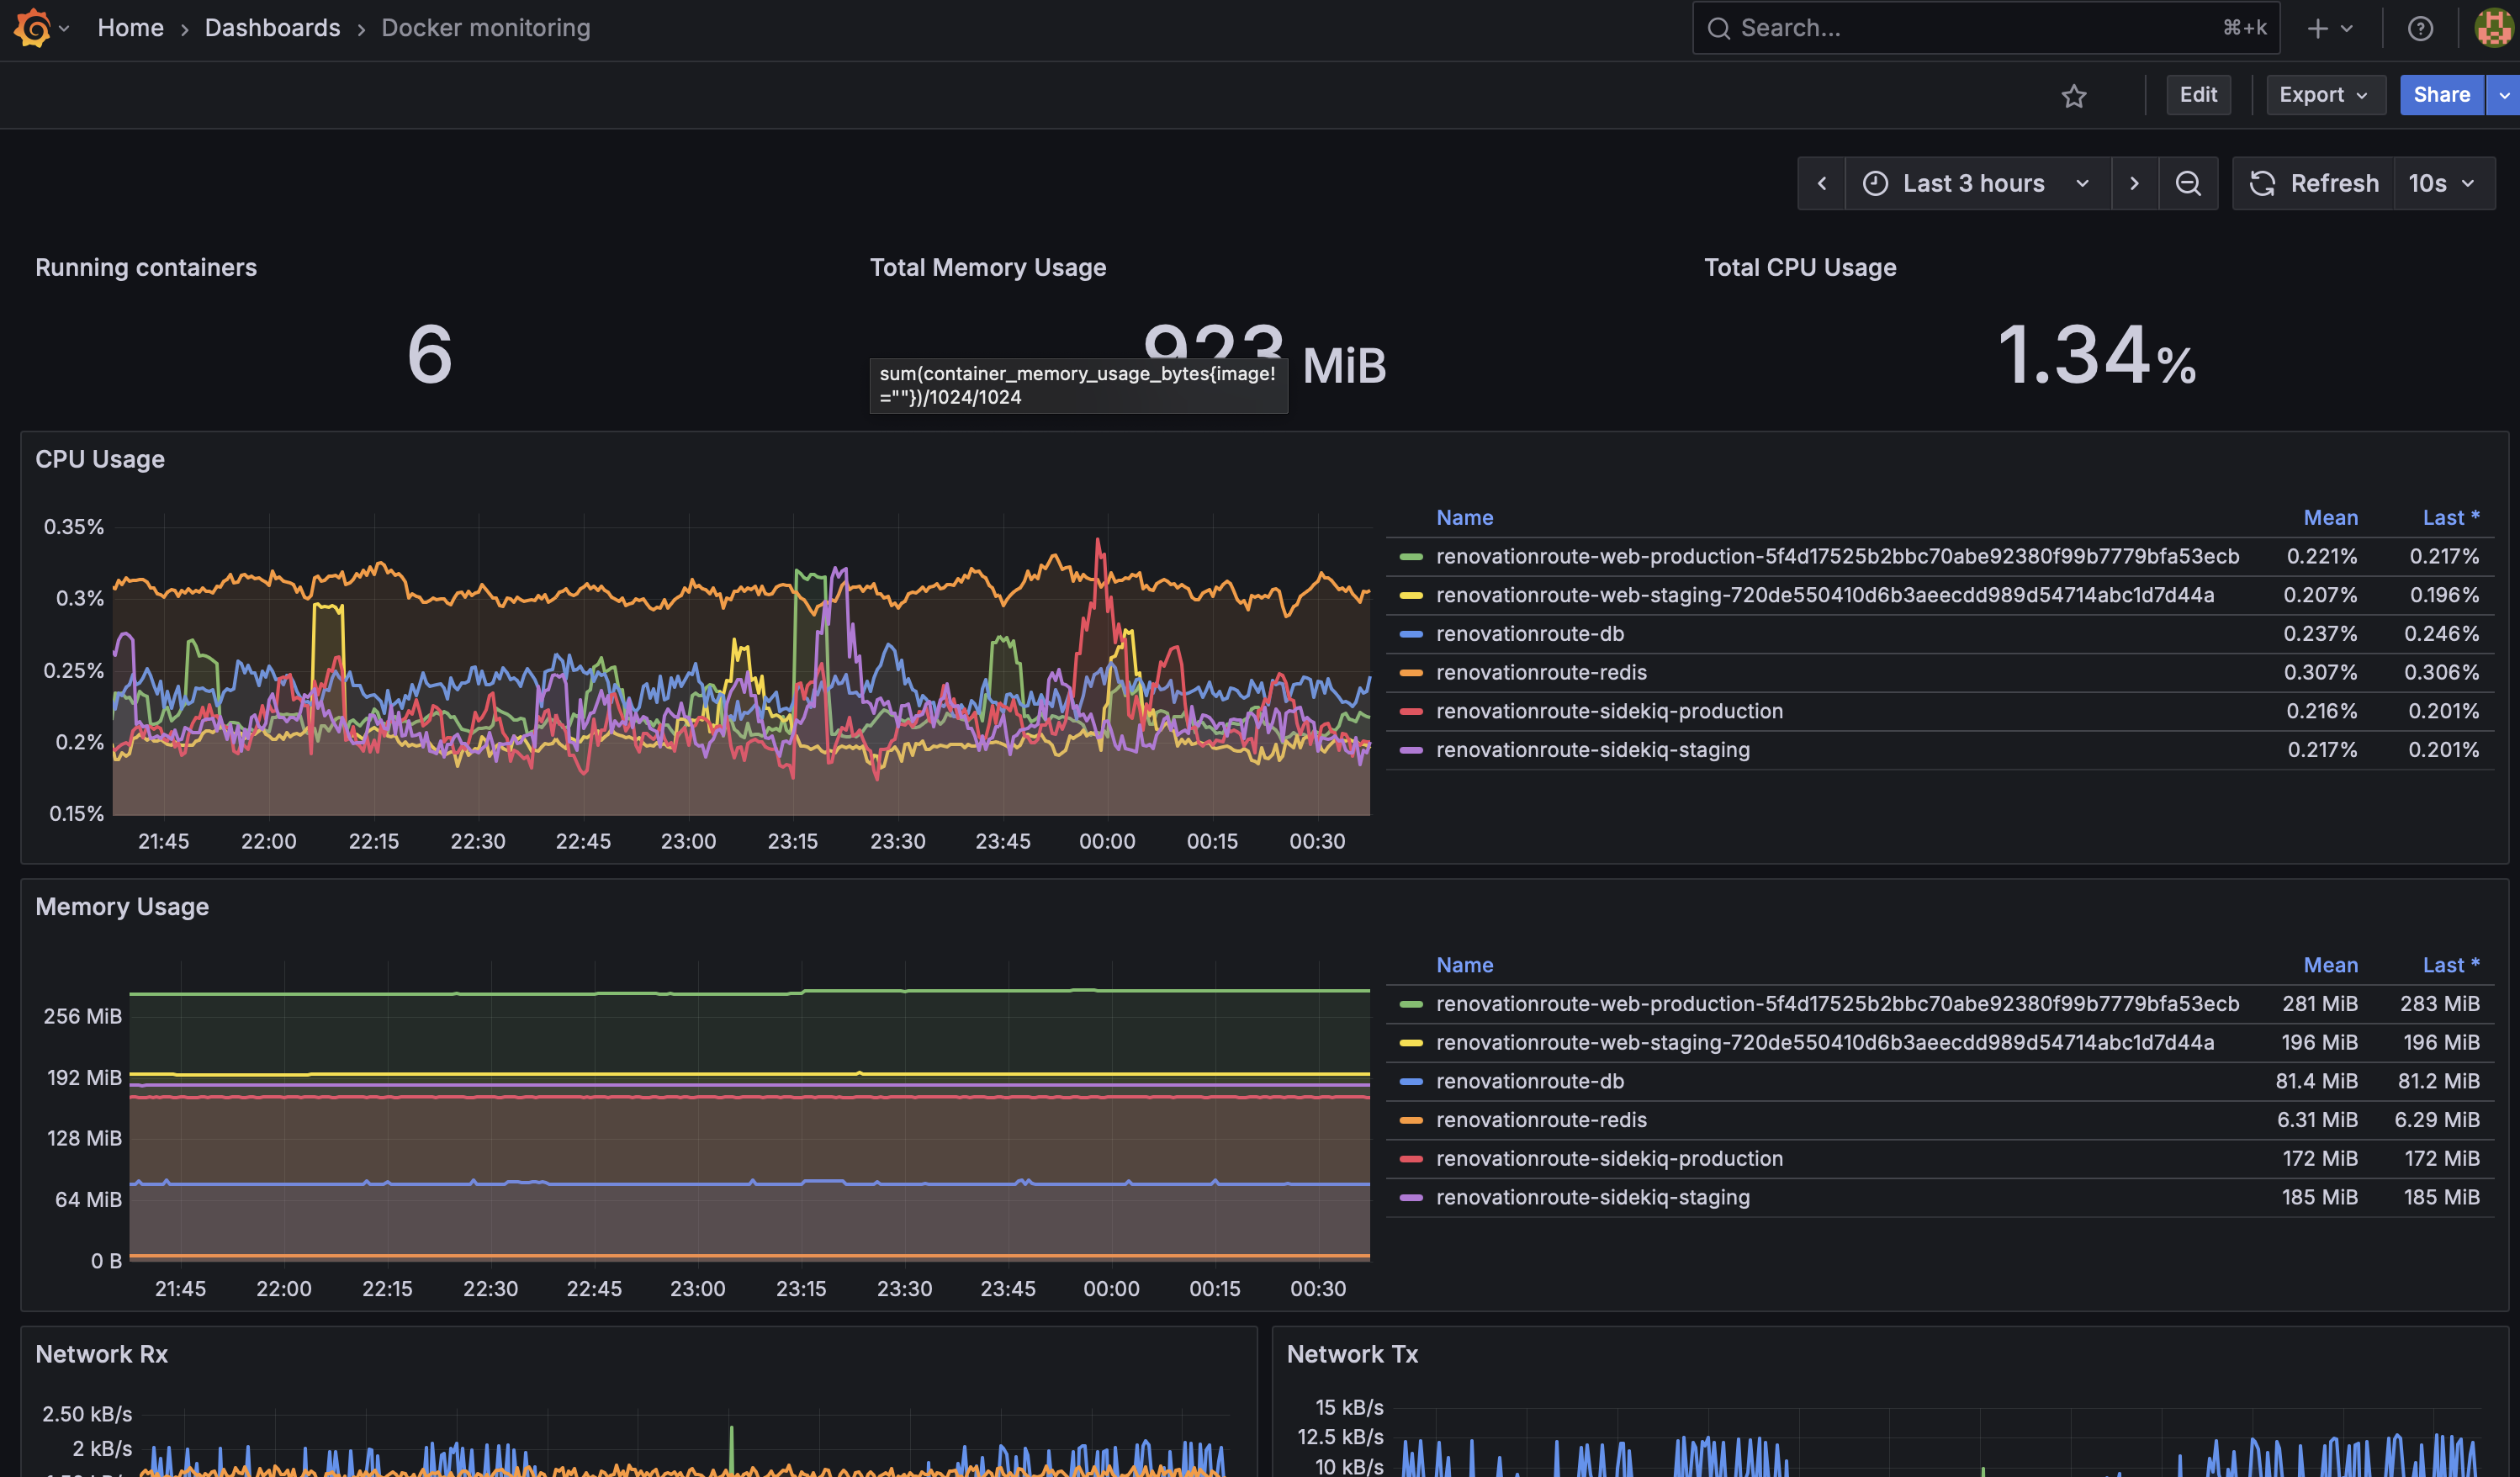
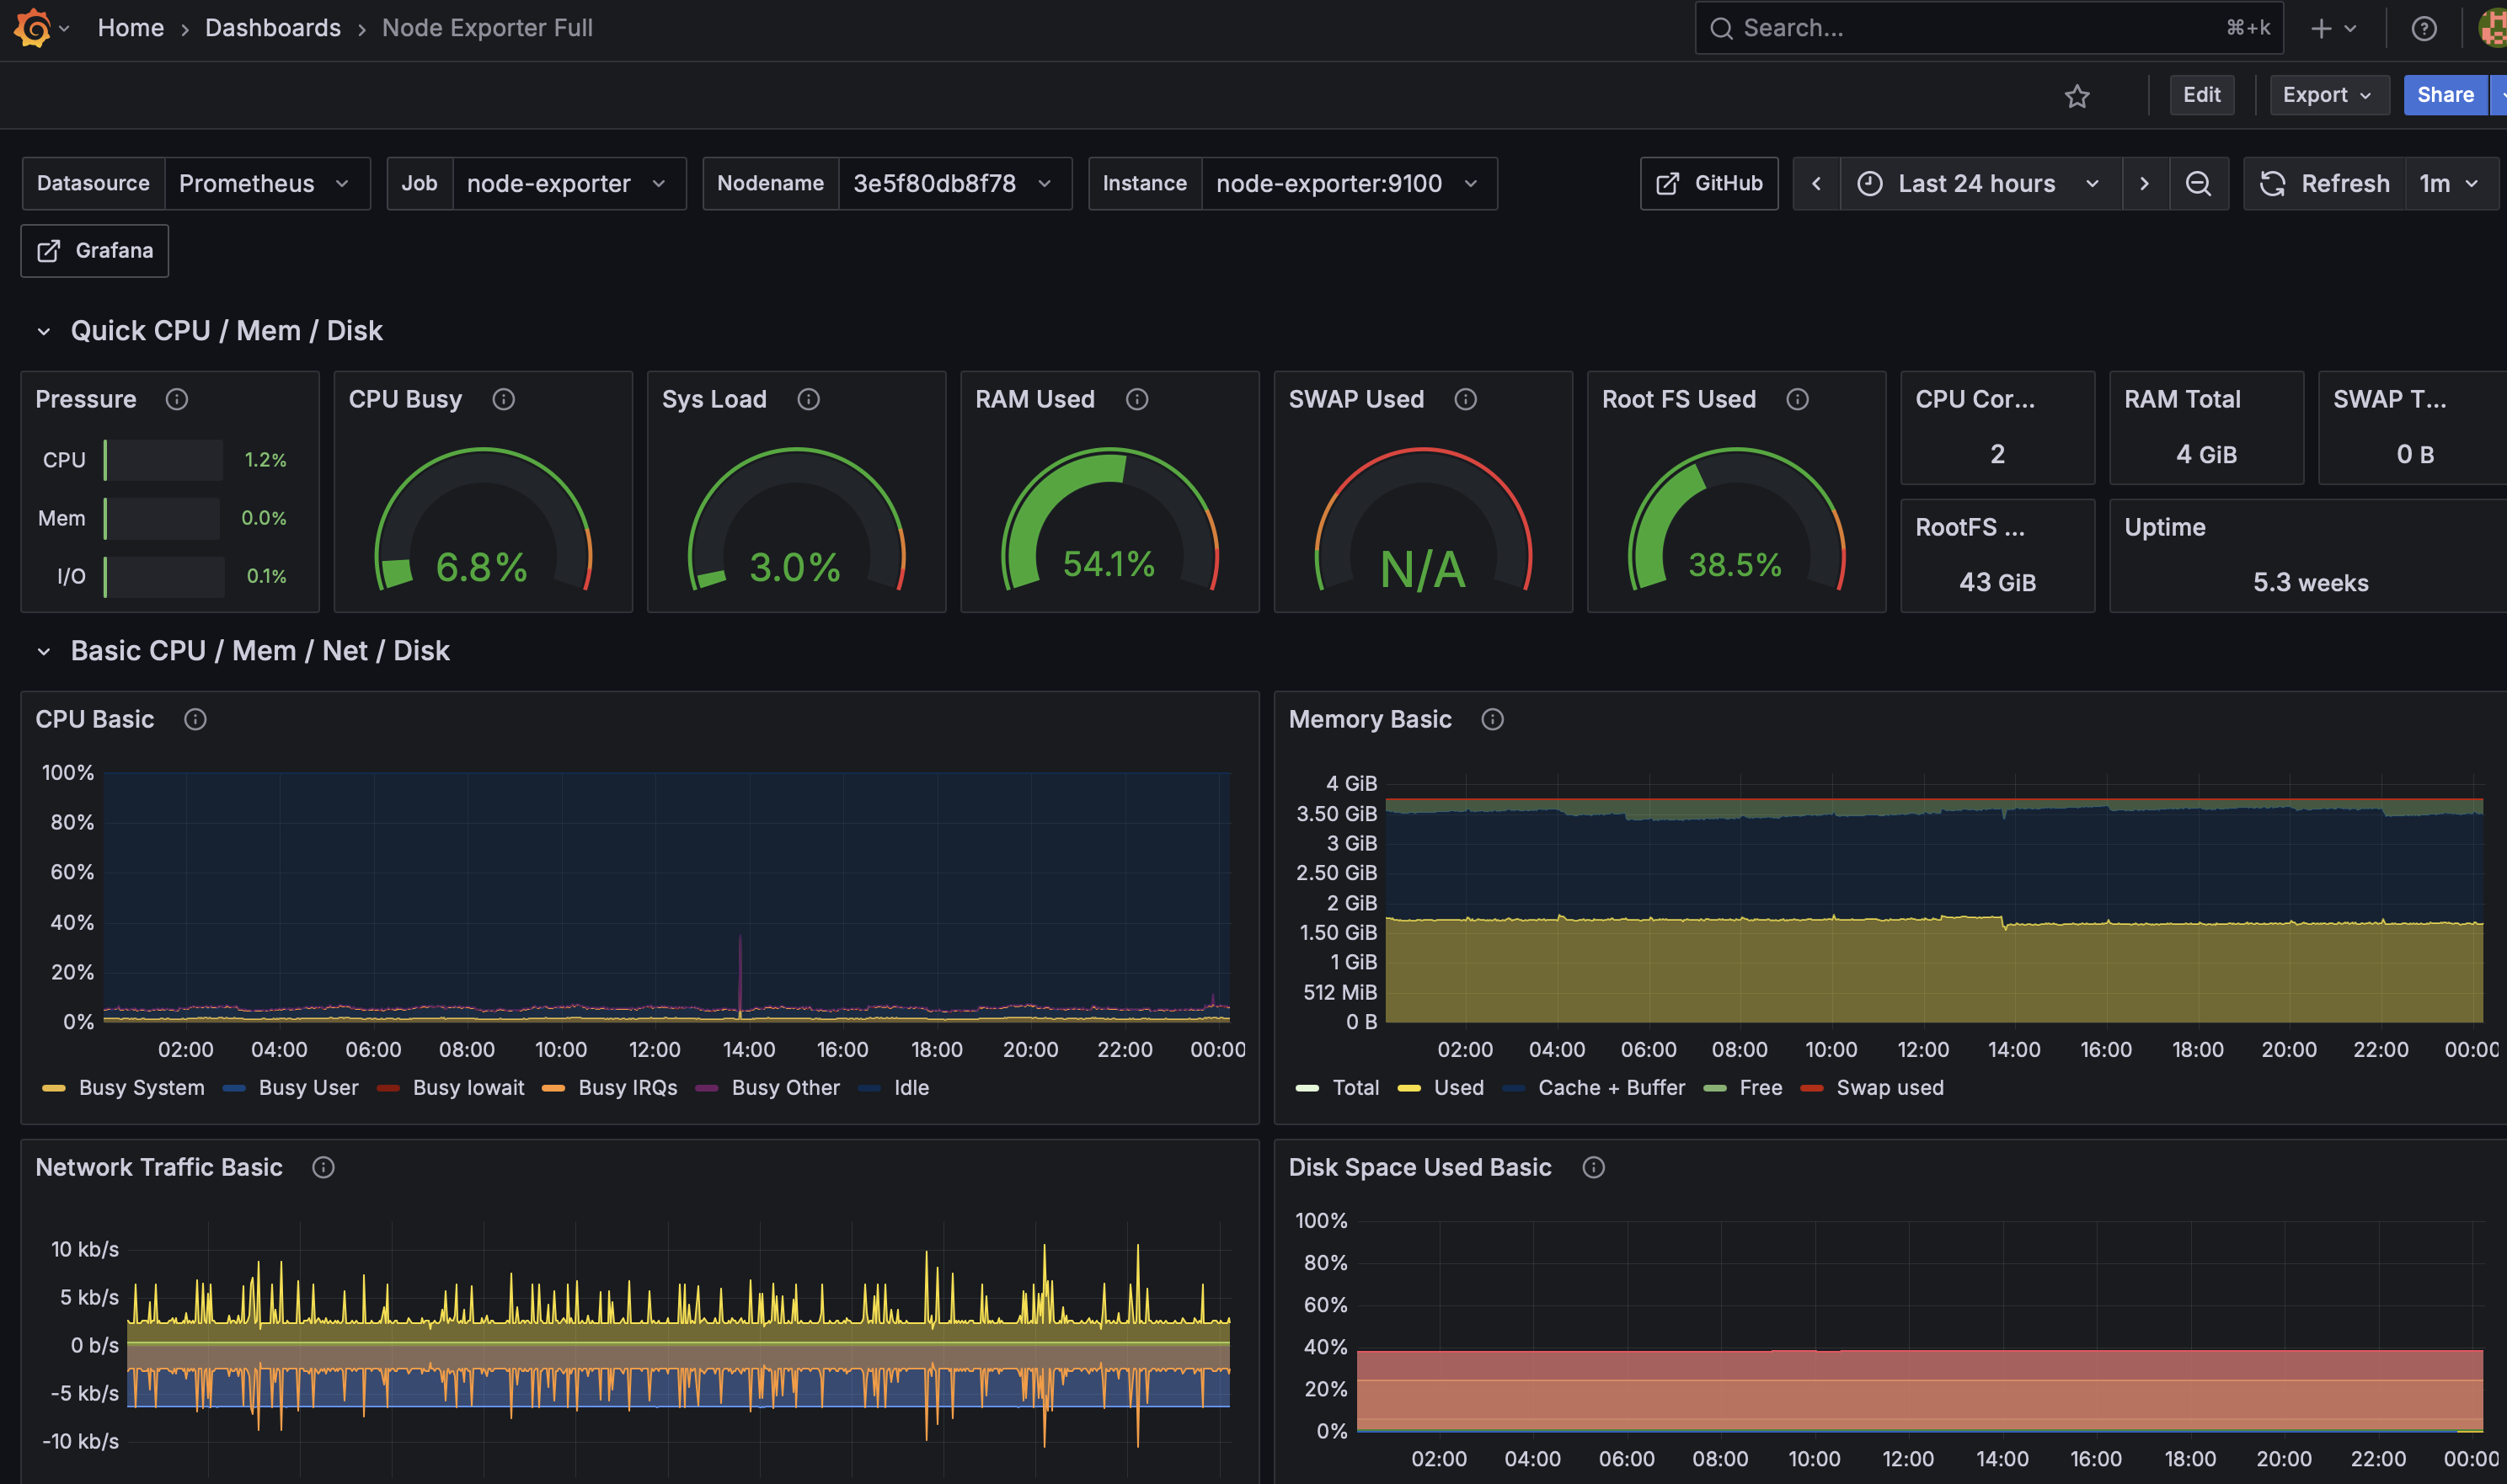
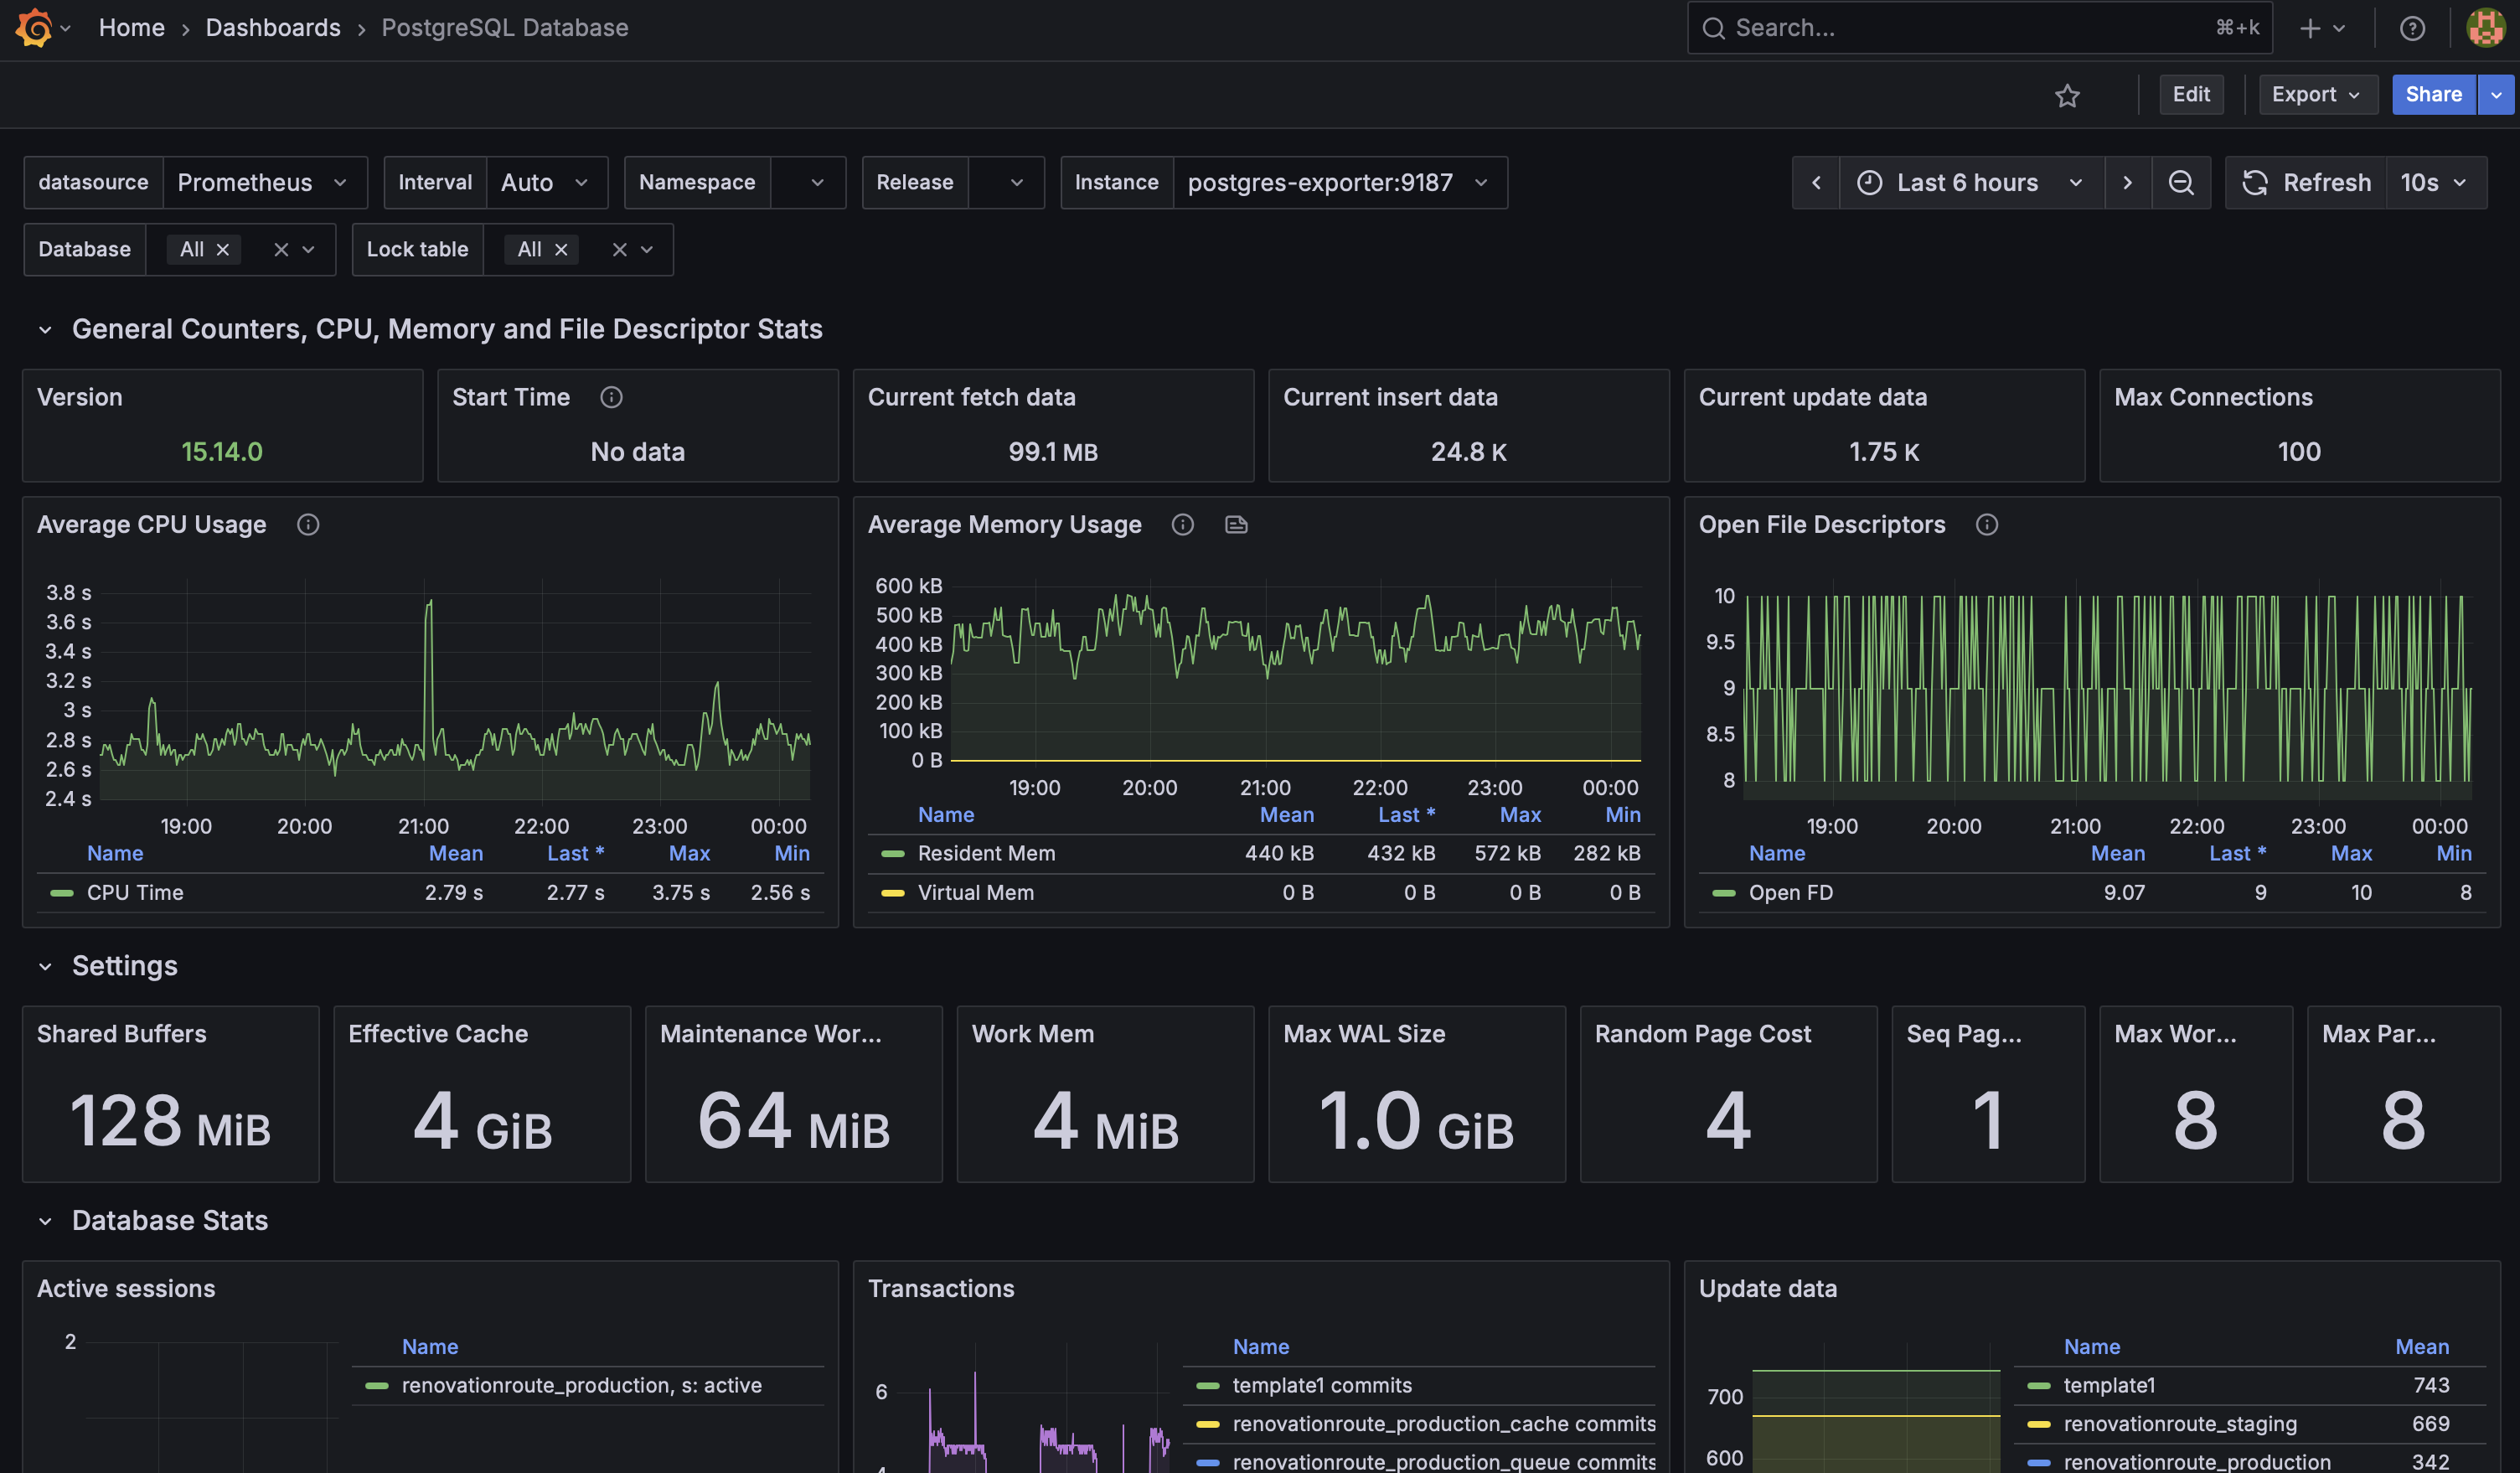
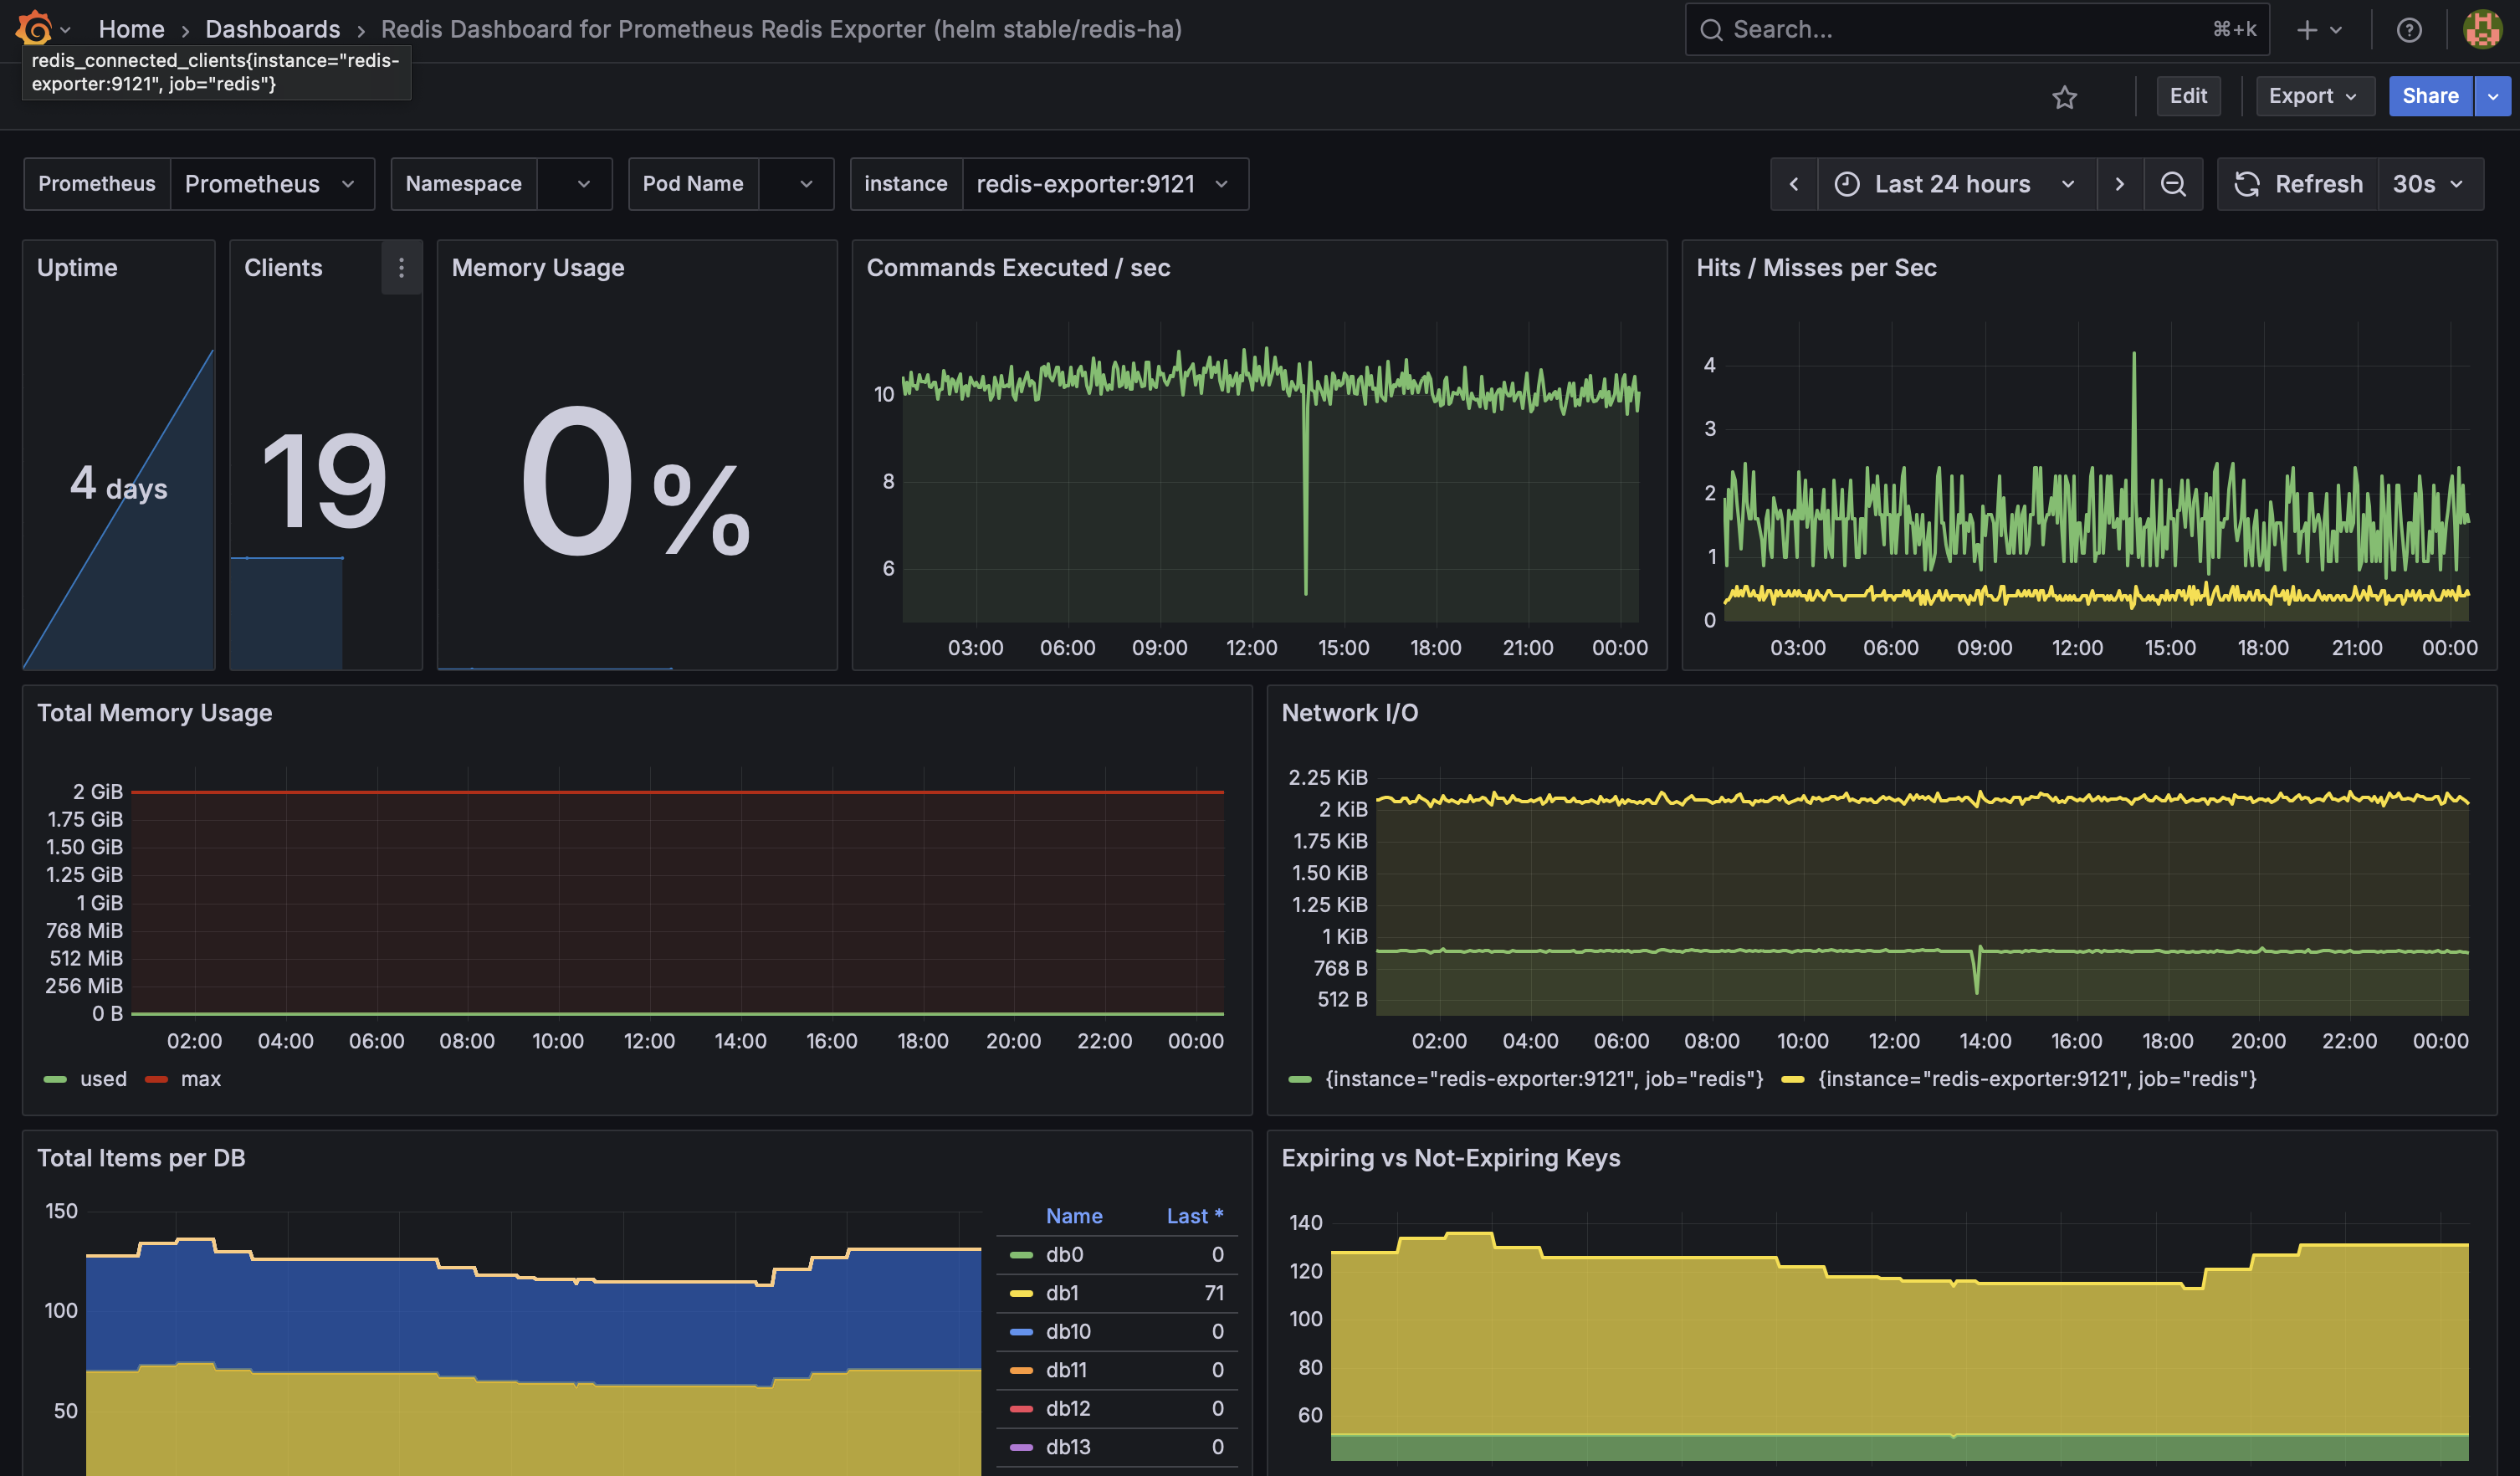
Real-Time Monitoring
See Everything
CPU, memory, disk, network. Database queries. API response times. All in one place.
Track What Matters
Custom dashboards for your specific metrics. No generic templates.
Historical Data
See patterns over time. Debug issues that happened yesterday or last week.
What You Get
Complete setup
I install everything, configure dashboards, set up alerts.
Ongoing support
Updates, new dashboards as you add services, alert tuning.
Typically live within a week.
From kick-off to working dashboards.
You own it
Open source tools. No vendor lock-in. Cancel anytime.
Stop Flying Blind
Get dashboards. Get alerts. Get peace of mind.